Introduction to Amazon CloudWatch
Amazon CloudWatch is a monitoring service for applications running on AWS. It collects data (in the form of logs, metrics, and events) from running AWS instances, stores this data in a repository, and provides a dashboard that allows users to visualize this data and monitor the behavior and performance of running applications, detect anomalies, and possibly set alarms or take automated actions. This service can be a useful tool for systems engineers to optimize resource utilization, troubleshoot issues, and gain insights to improve the overall behavior of a cloud service.
Some of the data collected by CloudWatch (such as CPU utilization, network data transfer and disk usage metrics from AWS instances) are generated automatically by the AWS infrastructure, without any active involvement from applications running in the instances. For other types of data (such as application logs, or memory utilization), running applications must actively send the data of interest to CloudWatch, using a web API. Amazon has a reference implementation of a CloudWatch client application, referred to as the CloudWatch agent, which, when installed in an AWS instance, runs in the background alongside the other applications deployed in the instance, collects data from interest (either from running applications, or from the operating system), and sends this data to CloudWatch.
Interfacing Nanos with CloudWatch
The usual approach of running a background application (such as the Amazon CloudWatch agent) to send logs, events and metrics to CloudWatch from an AWS instance does not fit into a unikernel model where the main application is the only one allowed to run in a given instance. On the other hand, patching the main application to include a CloudWatch client implementation that runs within the application itself (e.g. as a parallel thread) can be time-consuming and error-prone. For these reasons, we implemented our CloudWatch client as a Nanos klib, which runs as a kernel service and does not require any modifications to the main application. For more information on Nanos klibs, read this tutorial.
Our CloudWatch klib periodically samples memory utilization metrics and sends them to Amazon CloudWatch as custom metrics, similarly to what the Linux CloudWatch agent does; more specificaly, the metrics being sent are (refer to the Linux CloudWatch agent documentation for a description of each metric) mem_used, mem_used_percent, mem_available, mem_available_percent, mem_total, mem_free and mem_cached. These metrics are defined as standard-resolution metrics (i.e. they are stored in CloudWatch with a resolution of 60 seconds), and have an associated dimension whose name is host and whose value is an identifier of the AWS instance from which they originate, formatted as ip-<private-ip-address>.<aws-region>.compute.internal (for example, ip-111-222-111-222.us-west-1.compute.internal); for background information on how metrics are published to CloudWatch, refer to the CloudWatch documentation.
The rest of this section describes how to deploy to AWS a Nanos application with CloudWatch support.
Pre-requisites
In order for an application to be able to send data to Amazon CloudWatch, it needs appropriate permissions. These permissions can be granted via policies assocated to IAM roles; if a given instance is associated to an IAM role with specific permissions, all applications running in the instance are able to retrieve the security credentials that are needed in order to access AWS resources that require those permissions. For CloudWatch, the permissions required for publishing data from an instance are represented by a policy called CloudWatchAgentServerPolicy. Thus, the first step is to create an IAM role with this policy, as explained in the AWS documentation. Take note of the name of your IAM role, because it will be needed when configuring a Nanos instance.
Configuration and Deployment
As usual, to create a Nanos image to be run on AWS, we use the Ops tool and supply a JSON file that contains the configuration settings for the image. To include the CloudWatch klib in the image, we need to put a Klibs attribute in the RunConfig section of the configuration file; the value of this attribute is an array of klib names: for CloudWatch, we need cloudwatch and tls (this former is the actual CloudWatch klib, the latter is a generic klib that contains cryptographic functionalites, which are used when signing the web API requests being sent to the CloudWatch server).
To enable sending memory metrics in the cloudwatch klib, the data sending interval (expressed in seconds) must be specified in the configuration file with a mem_metrics_interval attribute.
Finally, to associate to AWS instances created from this image the appropriate IAM role as discussed in the pre-requisites section, we use an instance profile. If you created the IAM role via the AWS Management Console, the console automatically creates an instance profile with the same name as the role; otherwise, you need to create an instance profile and add the IAM role to it, as explained in the AWS documentation. Then, the instance profile can be associated to an instance by adding an InstanceProfile attribute (with a value set to the instance profile name) to the CloudConfig section of the Ops configuration file. Below is an example of a complete configuration file, where the data sending interval is set to 60 seconds and the instance profile is named "CloudWatchAgentServerRole":
{
  "RunConfig": {
    "Klibs": ["cloudwatch", "tls"],
    "Ports": ["8080"]
  },
  "ManifestPassthrough": {
    "cloudwatch": {
      "mem_metrics_interval": "60"
    }
  },
  "CloudConfig" :{
    "ProjectID": "prod-1000",
    "Zone": "us-west-1c",
    "BucketName": "nanos-test",
    "InstanceProfile": "CloudWatchAgentServerRole"
  }
}
package main

import (
  "fmt"
  "net/http"
)

func main() {
  http.HandleFunc("/", func(w http.ResponseWriter, r *http.Request) {
    fmt.Fprintf(w, "Welcome to my website!")
  })
  http.ListenAndServe("0.0.0.0:8080", nil)
}
GOOS=linux go build webg.goops image create webg -t aws -c config.jsonops instance create webg -t aws -c config.jsonViewing Memory Metrics on CloudWatch
Now that we have a running instance, we can go to the CloudWatch Management Console in the AWS portal and retrieve the metrics published by the instance. From the left menu of the management console, select Metrics -> All metrics; then, our metrics can be found under the CWAgent namespace (i.e. the same namespace as used by the Amazon CloudWatch agent); after selecting this namespace, a host dimension should appear: selecting this dimension will list all metrics published by the instance, which can then be plotted or processed otherwise, as exemplified in the following screenshot:
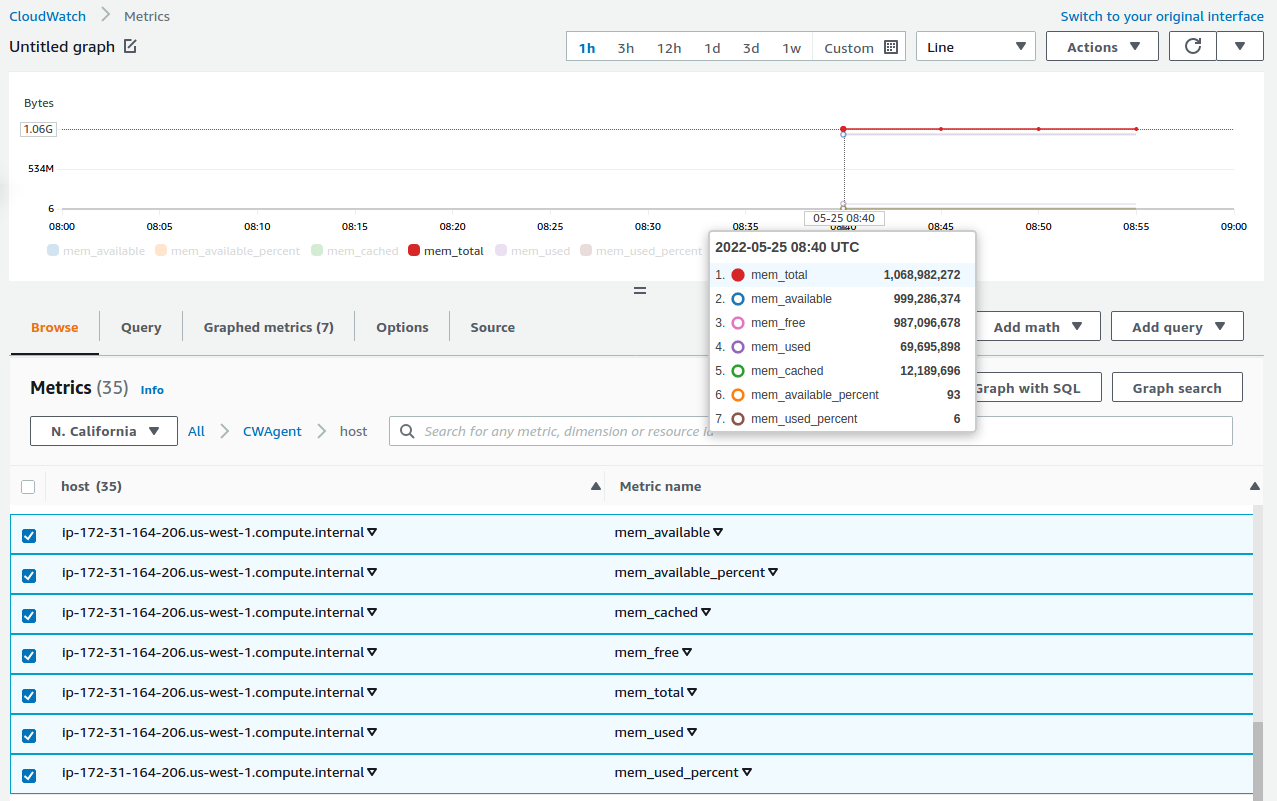
Note: the first time you run the instance, chances are that the metrics published by the instance are new metrics that were not previously present in the CloudWatch repository associated to your AWS account; in this case, these metrics will be created as new metrics, and it can take up to 15 minutes before new metrics appear in the CloudWatch dashboard.
