Benchmarks are easy to point out and say "this is slow." Hell, most PMs are very skilled at noticing that something has happened to slow something down. Almost anyone can whip out some apache bench or iperf. However, how do you diagnose the actual root problem so you can go about fixing it? What if it's new code, specifically kernel code, in a brand new kernel that doesn't have a traditional interactive userspace and doesn't support the concept of running multiple programs on the same vm?
ahem
Earlier on we had some fairly nasty code that was extremely slow. You know basic functions like memcpy and memset foolishly copying byte by byte. This is of course what happens when you have a team as small as ours blitzkrieging their way through 30 years of operating system development, but I digress. We needed to fix it. These sorts of problems we knew about but the "unknown unknowns" are a different matter.
The problem with these types of issues is that it's fairly hard to pinpoint the issue if you don't know where to look. This is where profilers come in. Profilers can do many wonderful things, but for the purposes of solving this problem we were concerned with finding the low hanging fruit of what is so dramatically slow.
Introducing a profiler wasn't just about fixing known performance issues we were seeing, it is key to securing the future. The fact is we're not just looking at a manycore future - we're looking at a "hella manycore" ™ future. In a world where running hundreds of hardware threads is the norm today, thousands of threads will be tomorrow. Nanos is a multiple threaded but single process system. It has explicit design goals to take advantage of these hardware threads. Most of the interpreted language universe is inherently single process single thread but I just don't see that working in the 2020s and beyond. I don't think it is realistic to expect people using those languages to migrate to other multi-threaded languages so I see language upgrades/replacements coming designed to deal with it instead.
As for Nanos, it is designed to only run as a vm, never directly on bare metal. However, our design goals are that it could be ran in a single thread environment, such as a microservice or it could be ran in a many many thread environment. There is also planned future work that could influence scheduling concerns as well.
Anywho, if you can't measure what you are trying to fix, "the slowness", then you can't fix it and all the cores and threads in the world don't matter. So let's measure it. Then let's fix it.
Prior Work
Despite some 100% false claims that exist, unikernels are very much debuggable, maybe even more so because it's only one program you are looking at versus the hundreds of processes you'll find on a fresh ubuntu instance and there's been extensive work done directly with profiling/tracing of them. We aren't nearly the first at all. Over 4 years ago Brendan Gregg introduced flame graphs to profile and trace them. (Yes, that Brendan Gregg.) Later on Florian Schmidt had plenty of work done with uniprof. At this point, anyone telling you you can't profile or trace one of these things is intentionally lying to you.
As for other common debugging tools like strace - well we've had that sort of functionality forever because it is precisely how we figured out what the hell a given interpreter was trying to do as we were adding support. Keep in mind these only run in vms so it's not like we could use the host strace to get this output. For instance here is me looking at some syscall output from a simple node.js hello world:
1 getpid
1 direct return: 2, rsp 0x76cfef68
1 rt_sigprocmask
1 direct return: 0, rsp 0x76cff6e0
1 mmap
1 mmap: target 0x0000000000000000, size 0x9000, len 0x9000, prot 0x0,
flags 0x20022, fd -1, offset 0x0
1    anon target: 0x70c39a0000, len: 0x9000 (given size: 0x9000)
1 direct return: 484317986816, rsp 0x76cff678
1 mprotect
1 mprotect: addr 0x00000070c39a1000, len 0x8000, prot 0x3
1 direct return: 0, rsp 0x76cff6a8
1 clone
1 clone: flags 3d0f00, child_stack 0x00000070c39a7f70, ptid
0x00000070c39a89d0, ctid 0x00000070c39a89d0, newtls 70c39a8700
1 direct return: 7, rsp 0x76cff698
1 rt_sigprocmask
1 direct return: 0, rsp 0x76cff6e0
1 rt_sigaction
1 direct return: 0, rsp 0x76cff570
1 rt_sigprocmask
1 direct return: 0, rsp 0x76cff6e0
^Csignal: killed
➜  tea  ops pkg load node_v13.6.0 -d -a hi.js
The '-d' turns this output on (along with some other useful debugging output). For a real world example of why this functionality is useful you'll notice something strange when you look at the filesystem for node. You can do this via the pkg contents command via ops:
➜  ~  ops pkg contents node_v13.6.0
File :/node
File :/package.manifest
Dir :/sysroot
Dir :/sysroot/lib
Dir :/sysroot/lib/x86_64-linux-gnu
File :/sysroot/lib/x86_64-linux-gnu/libc.so.6
File :/sysroot/lib/x86_64-linux-gnu/libdl.so.2
File :/sysroot/lib/x86_64-linux-gnu/libgcc_s.so.1
File :/sysroot/lib/x86_64-linux-gnu/libm.so.6
File :/sysroot/lib/x86_64-linux-gnu/libnss_dns.so.2
File :/sysroot/lib/x86_64-linux-gnu/libnss_files.so.2
File :/sysroot/lib/x86_64-linux-gnu/libpthread.so.0
Dir :/sysroot/lib64
File :/sysroot/lib64/ld-linux-x86-64.so.2
Dir :/sysroot/proc
File :/sysroot/proc/meminfo
Dir :/sysroot/usr
Dir :/sysroot/usr/lib
Dir :/sysroot/usr/lib/x86_64-linux-gnu
File :/sysroot/usr/lib/x86_64-linux-gnu/libstdc++.so.6
What the hell is /proc/meminfo doing in there? I thought this wasn't linux? It isn't but rather than having to go through and make a million modifications in all the commodity software we wish to support we will sometimes place one-off stubs for things we don't currently or won't ever support in their place instead. In this case without that file the interpreter will choke but with a 0 byte stub we are g2g.
However, strace should not be confused with profiling and honestly it is the wrong tool for almost everything. I've been at more than a few shops where people were strongly reprimanded for pulling out strace on a box with a live prod db. It slows things down tremendously because of how it actually works. It utilizes ptrace.
It really makes you wonder how in the world did the gVisor project get the 'ok' at Google? I get that there is a lot of backlash in the security community against kubernetes and so they had to do something but positioning ptrace as an optional 'platform' is just a complete non-starter. Even the most trivial toy/hello world projects are going to be "syscall heavy". Ruby clocks in at 1400! syscalls for a hello world! There was a recent paper in HotCloud entitled "The True Cost of Containing: A gVisor Case Study", with none other than the famous Arpaci-Dusseaus. In it they find some observations like:
File Access can be up to 200X Slower!
As an aside, I'm really bummed that Andrea and Remzi have popularized the notion that containers are a form of virtualization but I can see why they have used that language as it very much was a function of how they laid our their book, which I recommend as being an extremely accessible text. I view "containers" and classic hardware virtualization as two completely different types of software that most definitely do not do the same thing and have very different capabilities.
Let's turn on Ftrace
Ok, back to tracing and profiling - let's fix this slow code.
When you are profiling an individual application you will probably use different tools than the ones you use to profile a kernel. In that case one might turn to ftrace. Of course, that is if you are using Linux. Well, Nanos ain't linux and it's not a general purpose operating system either. It very much blurs the line between what an application and an operating system is. Rather than re-inventing the wheel one of our brilliant engineers ported ftrace over. So we now have rudimentary ftrace support available in Nanos.
To bring it full circle you can now look at all the function entry and exits inside the kernel and figure out what is slow.
To follow along in this tutorial you'll obviously need the Nanos source. You'll also want python with pandas and plotly. There are two little python snippets included in the tools dir.
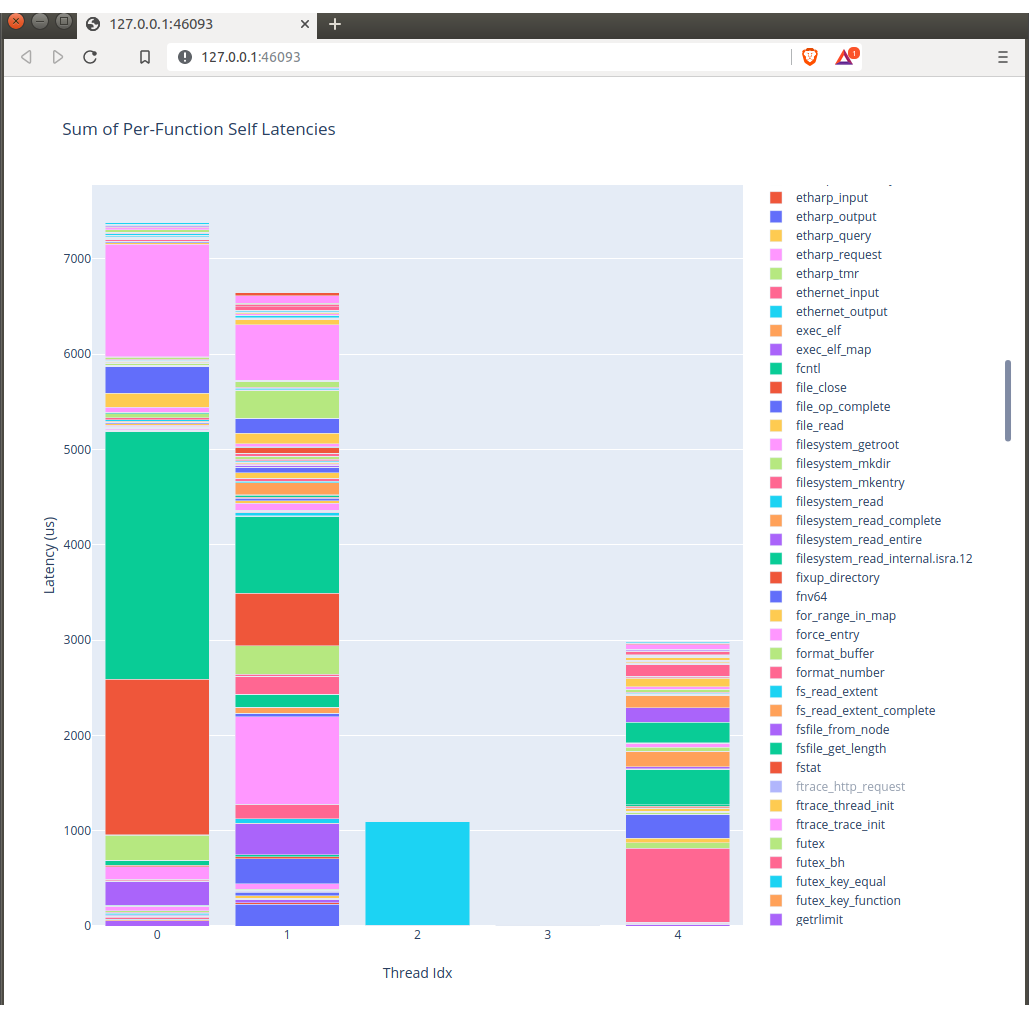
The first python app formats the *very large* trace dump while the second draws a neat little toggable graph using plotly showing you what is expensive tracking core utiliziation per function call.
To drill in on various calls you can click on the bars to toggle them on or off.
For now we do not expose this functionality inside of OPS and the reason why is because it is explicitly made to profile kernel code and anyone who would be investigating and or fixing something is going to end up touching Nanos not Ops.
However, if you have the nanos tree you can specify the env var TRACE to be ftrace and you are off to the races. For those who have not built with Nanos before there is a default make target called *ahem* TARGET that specifies a given binary to run. That pairs itself with a filesystem/image manifest (it's more than just a fs - this deserves its own blogpost). Most normal users should never have to think about that though.
make clean && make TRACE=ftrace TARGET=my-server runSpecifying the trace target will spawn a webserver with a '/ftrace/trace' endpoint. This is another reason why this is toggable, off by default, and not present in OPS proper.
wget http://localhost:9090/ftrace/traceFrom there you can download the tracefile. There are a few options on how to collect it, however, be aware that even modest amounts of traffic produce very large trace files. Remember - the goal is not to fix a live prod system - it's to replicate the behavior in a controlled environment and debug locally. I know it has become a thing to "ditch the staging environment" or "debug in prod" or even lol "code in prod" but this is precisely why we have staging envs.
We run the first little python script to format the trace into a csv.
./parse-trace.py traceThis produces a nice 'little' trace.csv of which we can produce a graph like so:
./runtime-breakdown.py trace.csvThen you get nice little graphs like this:
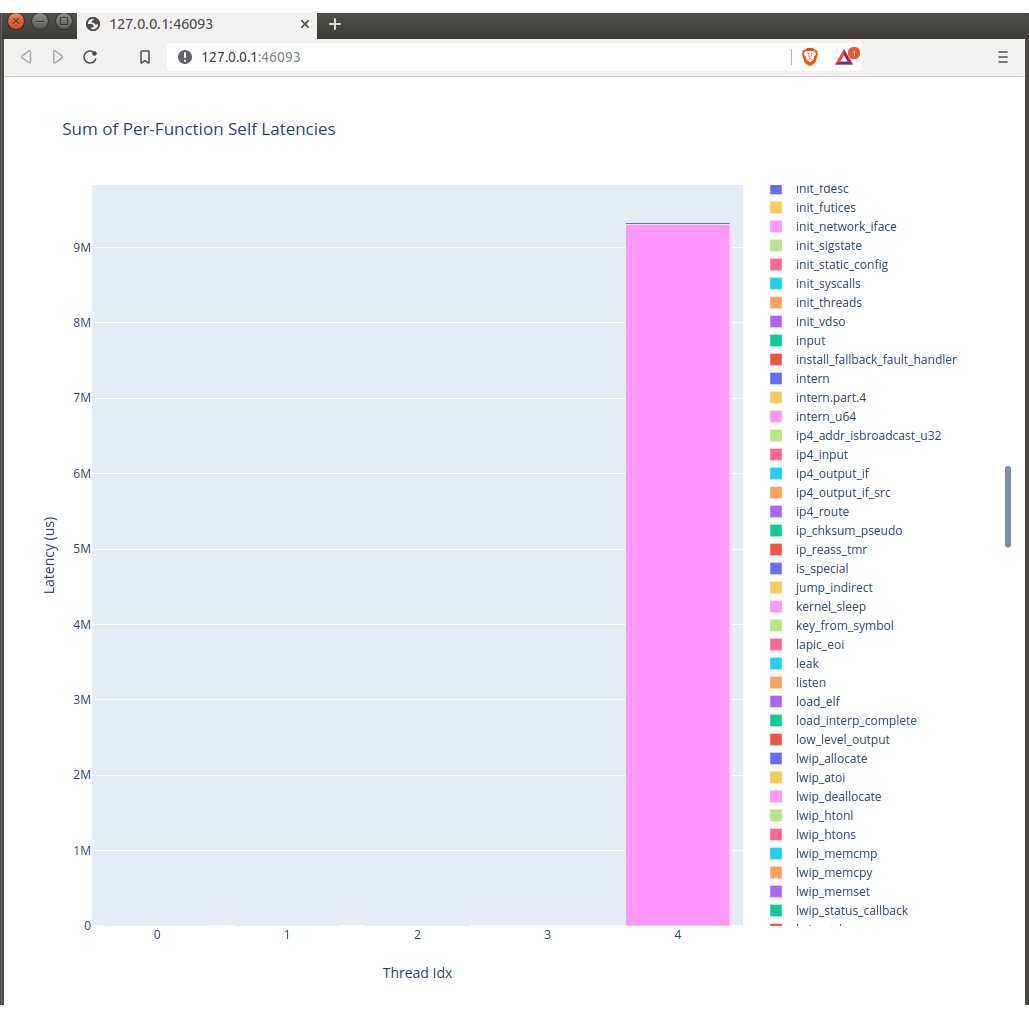
and like this:
Perhaps in the future we'll turn this on via a toggle on OPS but right now it's mostly meaningless if you aren't elbows deep in nanos code.
If you're a performance nut you'll love diving in and we could obviously use all the help we can get. Until next time...
